
Our Application
Aroaro XR Environment
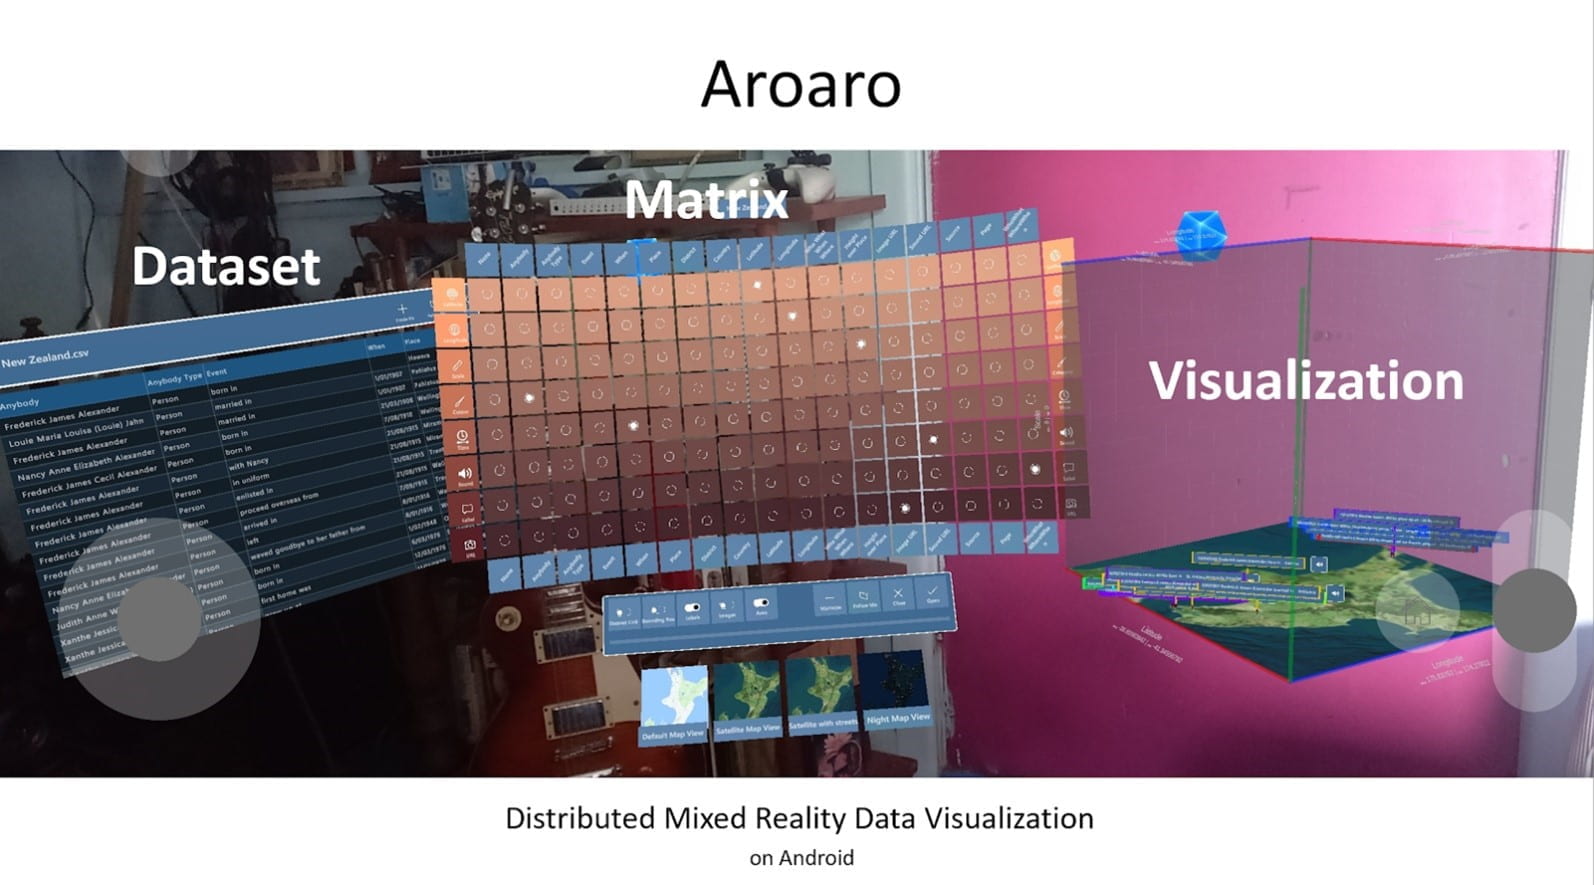
Our distributed mixed-reality environment, Aroaro (Presence) enables decision-makers to interact simultaneously over a common visual display of abstract data while providing each participant with their own perspective of the dataset. The ability to “move” (walk or fly) through the data coupled with a query filtering and highlighting enhances a user’s perception of the information that can be revealed and used in analysis and deliberation. This is possible thanks to an excellent team. Human power is powerful.
Innovative way
Create a Visualisation from a Dataset
Create visualisation in Aroaro
We believe that everything can be collected as DATA, but it may be not easy for everyone to find useful insights in massive data. 2D data visualistion may be limited. In aroaro, we deisgned an innovative way to using Mapping Matrix to map DATA to VISUALISATION.
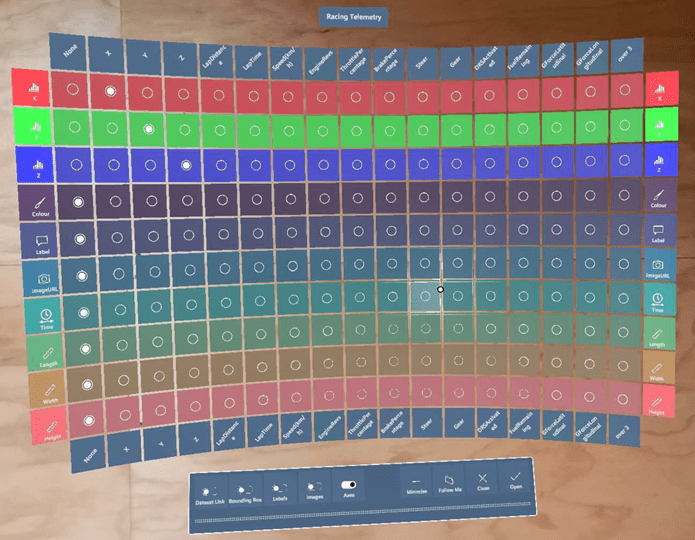
mAPPING MATRIX
Visualisation created by mapping data attributes to point attributes.

Your content goes here. Edit or remove this text inline or in the module Content settings. You can also style every aspect of this content in the module Design settings and even apply custom CSS to this text in the module Advanced settings.
use case 1
Tabular Dataset 3D Visualiston

Open dataset
You are able to scroll it to see more data and attributes with your controllers in Aroaro VR or with your hand in Aroaro AR.
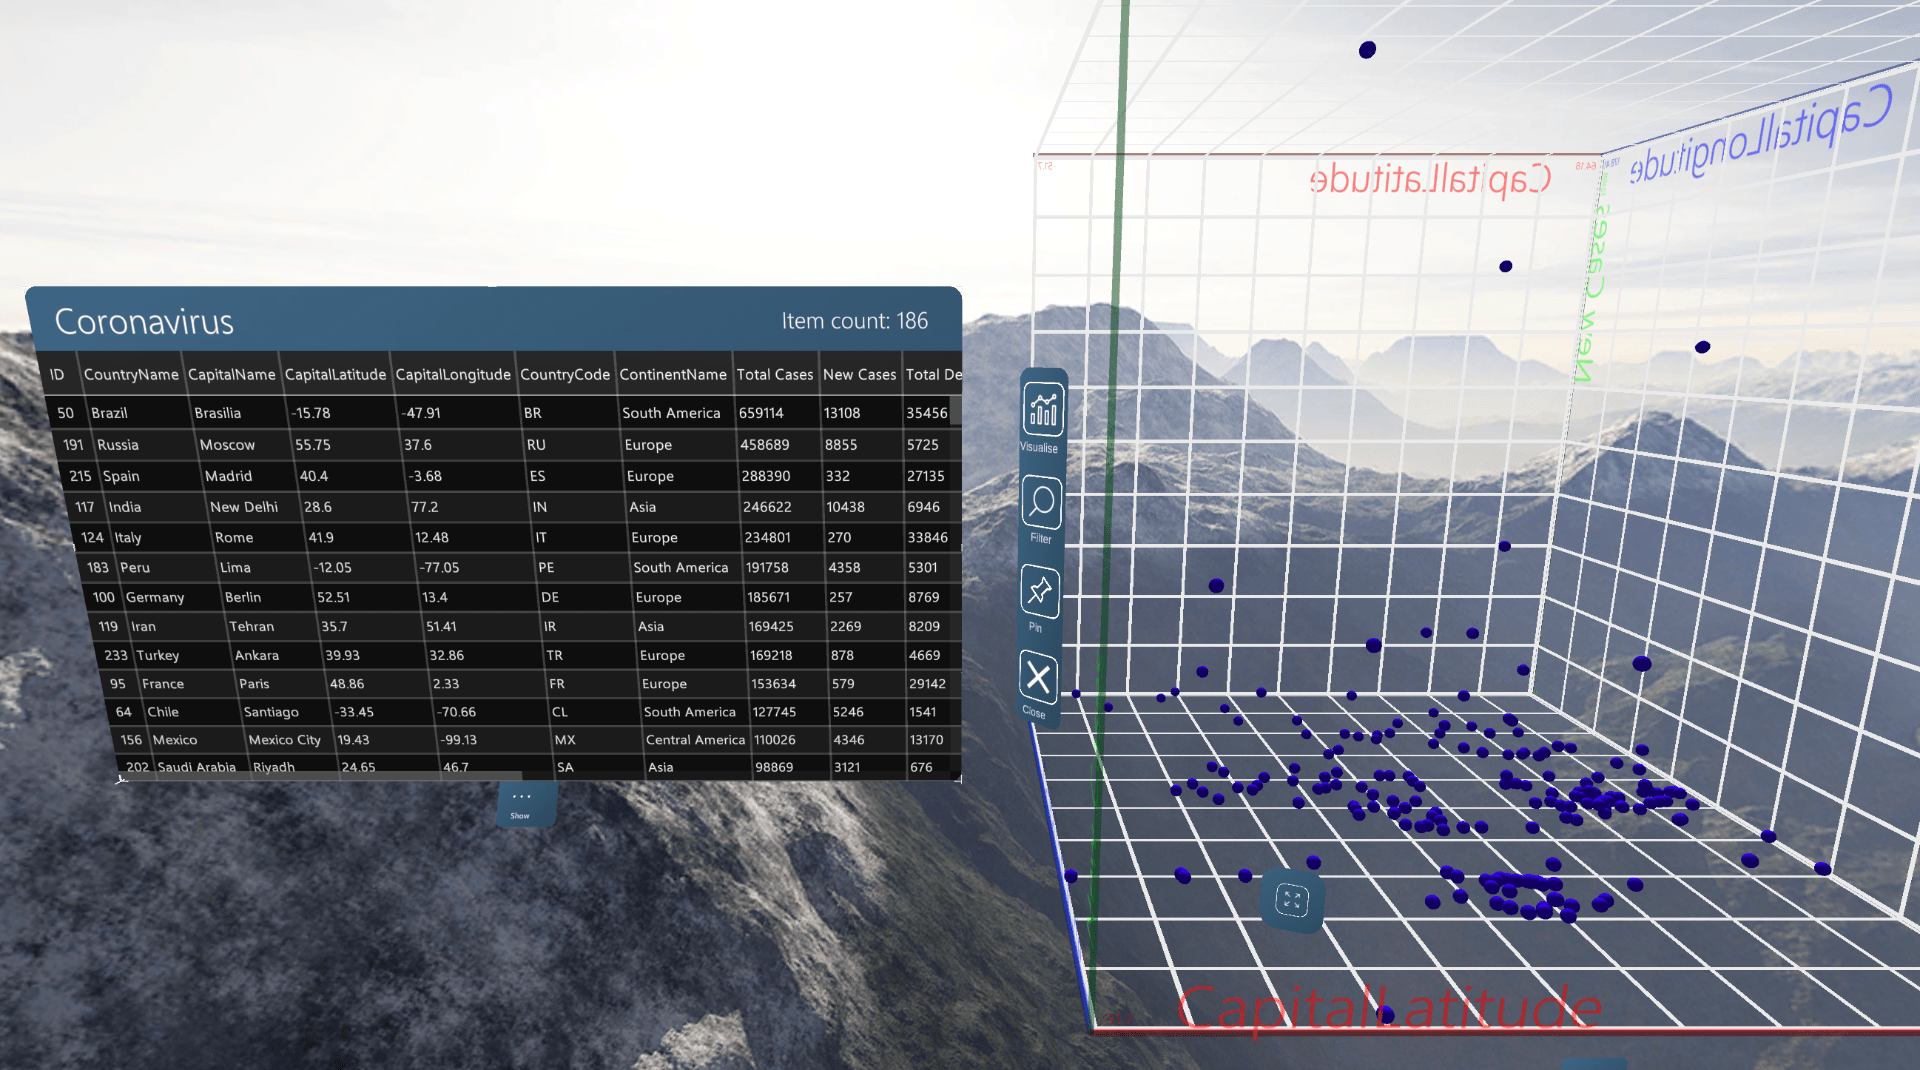
Create 3d SCATTER PLOT visualisaton
A Scatter plot is a common type of visualisation on 2D platforms. In Aroaro, you can create it in 3D manner. You are able to roate it with your controller or hands, walk or fly into it and toch it! The data can be around you! We aim to make better interactions for enjoyable experience in insight discovery journey.
use case 2
Network Dataset Immersive Visualisation
Users of Aroaro data visualization tools have a wide range of options for visualizing tabular data sets, but as rich as they may become, tabular data sets do not necessarily convey information about existing relationships or link between the entities, also known as nodes.
A network data set, on the other hand, necessitates two datasets:
- Nodes, the objects of interest.
- Edges, the links that contain the connectivity information of a network.
Aroaro Network Data Visualisation Engine
The video highlight the basic functions available in Aroaro VR for network dataset visualisation.
Please watach to see how does immersive data visualisation with Network Dataset can help your business, research and analytics.
What applications are used in Mapping Matrix?
Hi, thanks for your comment.
It’s Aroaro, the Extended-reality software we are developing. 🙂 You can view more applications here: https://aroaro.blogs.auckland.ac.nz/application/
Cheers,
Jing