
Immersive Analytics
ExperimentResearch
What is Immersive Analytics (IA)?
According to Marriott et al. (2018), Immersive Analytics (IA) is “the use of engaging, embodied analysis tools to support data understanding and decision making.” Immersive analytics builds upon several features, such as data visualization, visual analytics, virtual reality, computer graphics, and human-computer interaction, to support data understanding and individual or collaborative decision-making. IA is a new technology that uses head-mounted VR/AR or hand-held equipment to provide new kinds of display and interaction technologies, such as sensor technologies as well as machine learning.
Frequently Asked Questions
How does Aroaro work for IA?
As Aroaro expanded, we refocused its purpose data visualization platform to allow users to visualize and analyse data. The latter aligns with a novel area of research known as Immersive Analytics. The ultimate purpose of Aroaro’s immersive analytics engine is quality decision-making.
What is the benefit that IA can bring to us compared to analytics on 2d
We reckon that IA might cause the decision-making process to be more effective and drive higher-quality decisions. Using an immersive way to visualise complicated data may make the discovery of insight and hidden relationships from data easier by turning big data into intuition. This may overcome the bottleneck of data visualization.
How do you prove it?
We prove our research in the following ways:
- We hire experiment participants to contribute to our research.
- Participants read the background of a dataset for a fictional marketing campaign. They visualised the dataset with both 2D software – Gephi and XR Aroaro to make several decisions.
- We care about their speed and decision quality. Also, we observe their decision-making process.
- Data analysis is conducted.
- Note: We are looking for more participants to join us to get more records to increase the statistical power of our results. You can contact us if you want to be part of this process.
demo
Aroaro with IA
We argue network information is becoming of heightened strategic importance to many business organizations. The context of the problem presented here refers to the assumption that a particular business organization has access to a network data set, which may be its own or a third party’s.
Let us consider a specific scenario where such a business organization finds it of utmost importance to its commercial activities to identify the most important members of the network.
Watch the tutorial.
experiment
Experiment Design
To research whether Immersive Analytics (IA) supports a more effective decision-making process, we are conducting an experiment comparing Aroaro with the 2D data visualization platform, Gephi.
Gephi is the leading 2D visualization and exploration software for all kinds of graphs and networks.


")
Aroaro – VR on Windows 10
experiment
Tools
Participants impersonate a mid-level manager in charge of advising a marketing campaign to make 12 decisions by using the immersive platform, Aroaro and the 2D network data visualization platform, Gephi.

Gephi 2D – Windows 10
Participants are able to fly into a fictional data set to visualise the interactions between nodes and the attributes of each node. They can run queries in Aroaro to support their analysis and decision-marking.


On Gephi, participants are able to visualise the same data set on the 2D desktop screen. They can run simple queries on Gephi as well. In order to make sure the experiment is fair to both platforms, participants will use the same functions on Aroaro and Gephi.
Experiment Snapshot

ar - hololens
Participant manipulated data on Aroaro AR

VR - Windows Mixed Reality
Participant visualiZed and interacted with data on Aroaro.
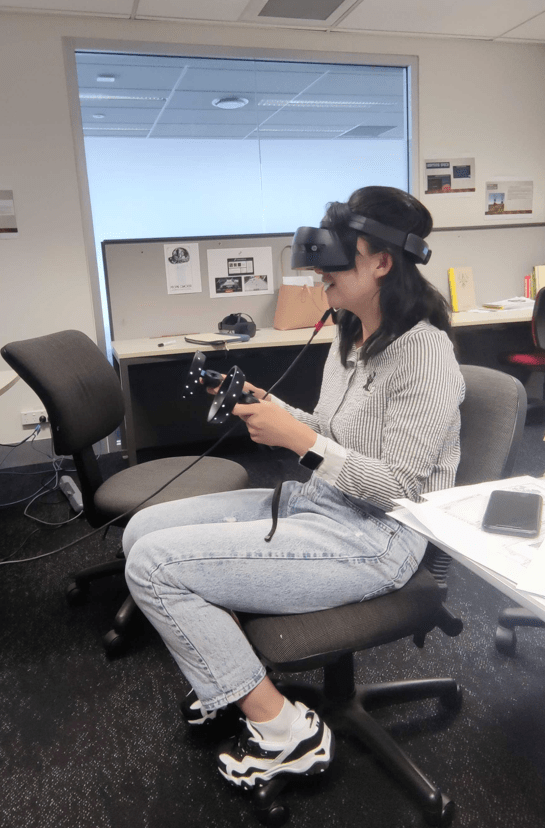
VR - WINDOWS MIXED REALITY
Participant visualized and interacted with data on Aroaro VR
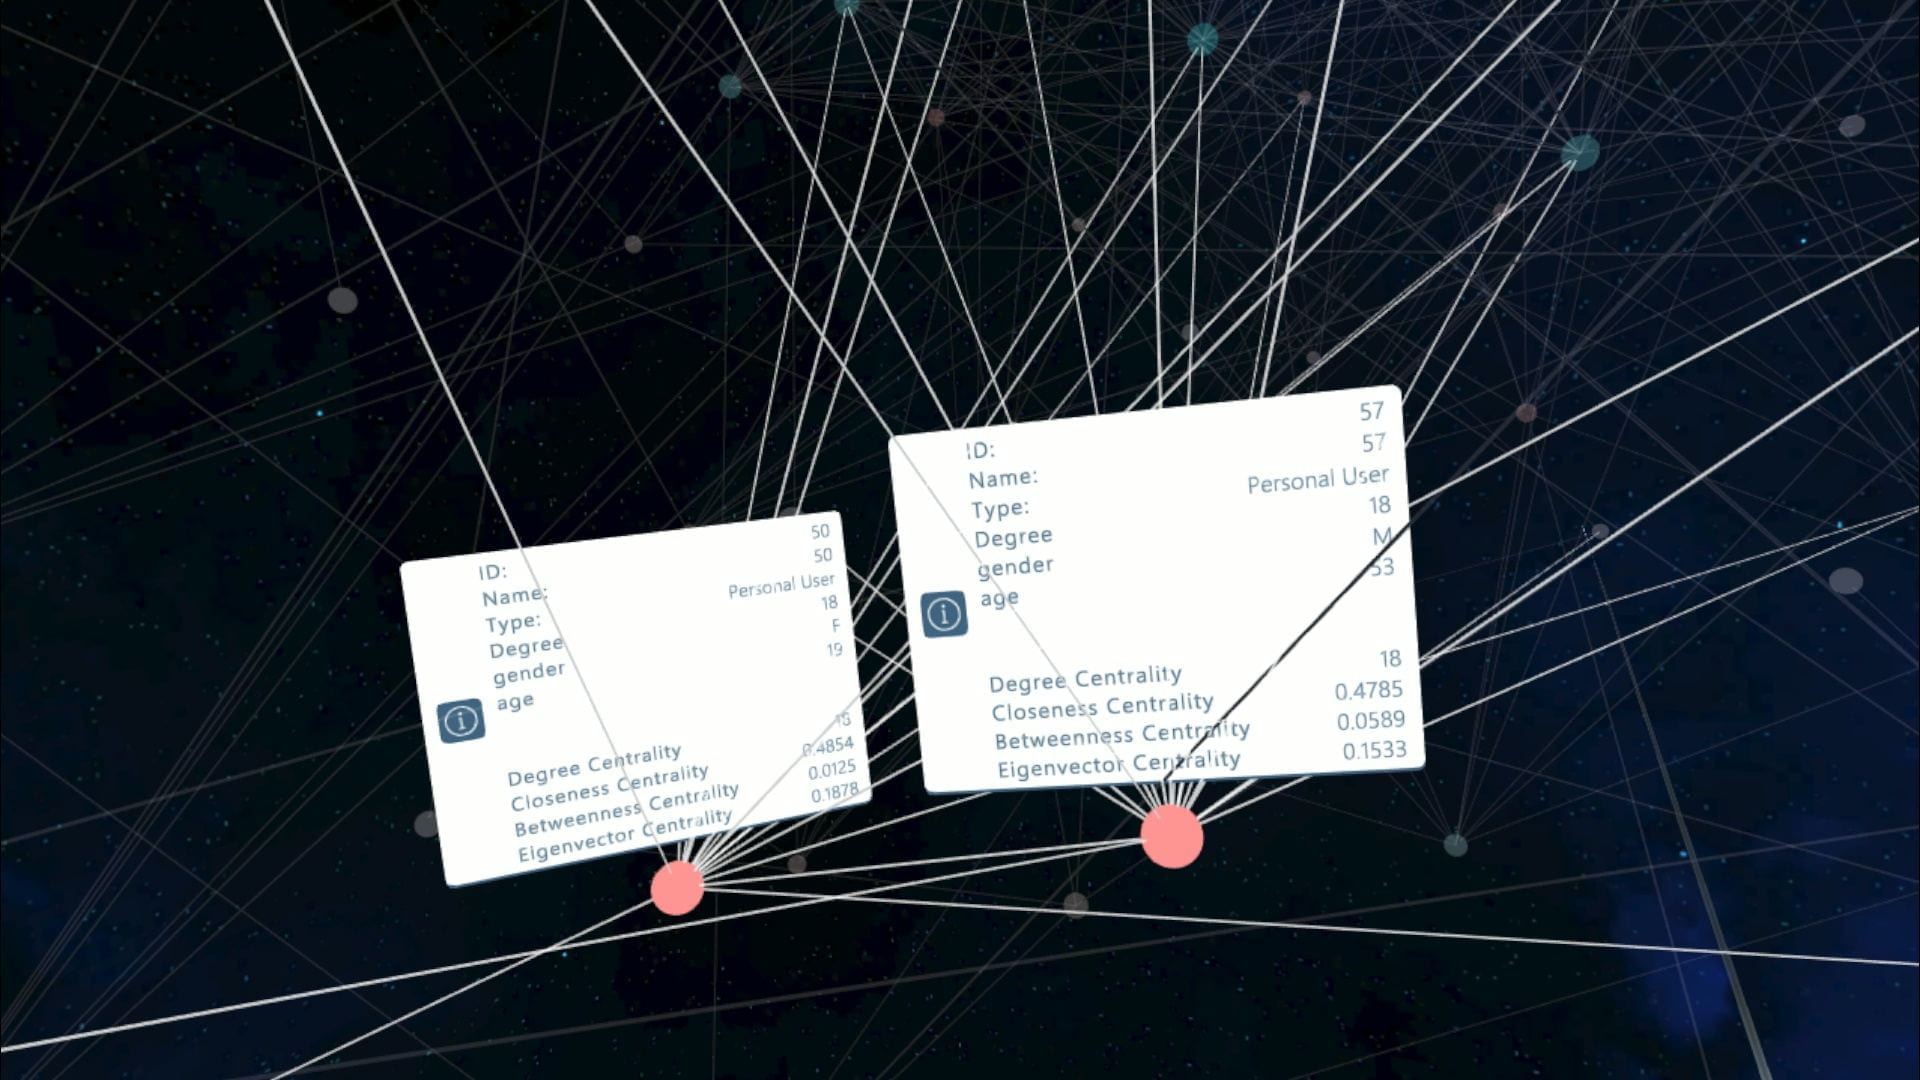
Network data
Network data visualization in Aroaro VR compares details to help decision-making.
Network Data
Interacts with data and fly around data.

Query oriented Menu
Uses Query Oriented Menu to help data visualization and decision-making during the experiment.